LeaveCellOut
LeaveCellOut implements spatial block cross-validation using a discrete
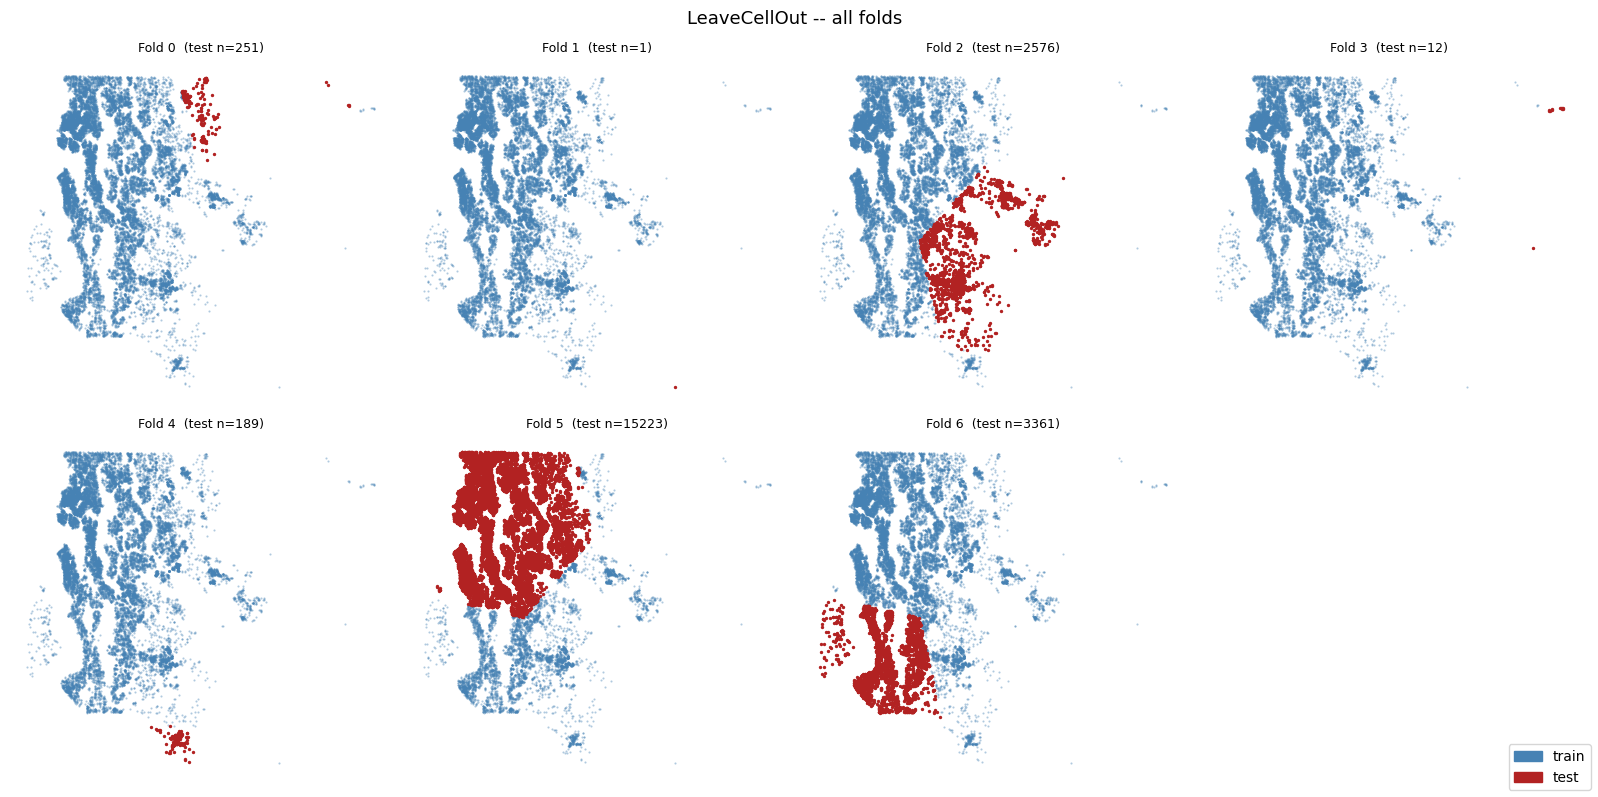
global grid system (DGGS). Each fold holds out one grid cell as the test set;
the training set is all observations in every other cell.
This is the leave-one-block-out analogue of CellStratifiedKFold, which
distributes each cell’s observations across all folds instead of holding them
out whole. Use LeaveCellOut when you want to evaluate how well a model
generalises to an entirely unseen geographic region.
import colormaps
import numpy as np
import pandas as pd
import geopandas as gpd
import matplotlib.pyplot as plt
import matplotlib.patches as mpatches

from geovalidate.cv import LeaveCellOut
/Users/ljwolf/miniforge3/envs/analysis/lib/python3.14/site-packages/tqdm/auto.py:21: TqdmWarning: IProgress not found. Please update jupyter and ipywidgets. See https://ipywidgets.readthedocs.io/en/stable/user_install.html
  from .autonotebook import tqdm as notebook_tqdm
DATA_PATH = '/Users/ljwolf/Dropbox/work/projects/spquadtree/code/kc_house_data.csv'

df = pd.read_csv(DATA_PATH)
gdf = gpd.GeoDataFrame(
    df,
    geometry=gpd.points_from_xy(df['long'], df['lat']),
    crs='EPSG:4326',
)
print(f'{len(gdf):,} house sales, '
      f'lat {gdf.geometry.y.min():.3f}-{gdf.geometry.y.max():.3f}, '
      f'lon {gdf.geometry.x.min():.3f}-{gdf.geometry.x.max():.3f}')
21,613 house sales, lat 47.156-47.778, lon -122.519--121.315
H3 grid
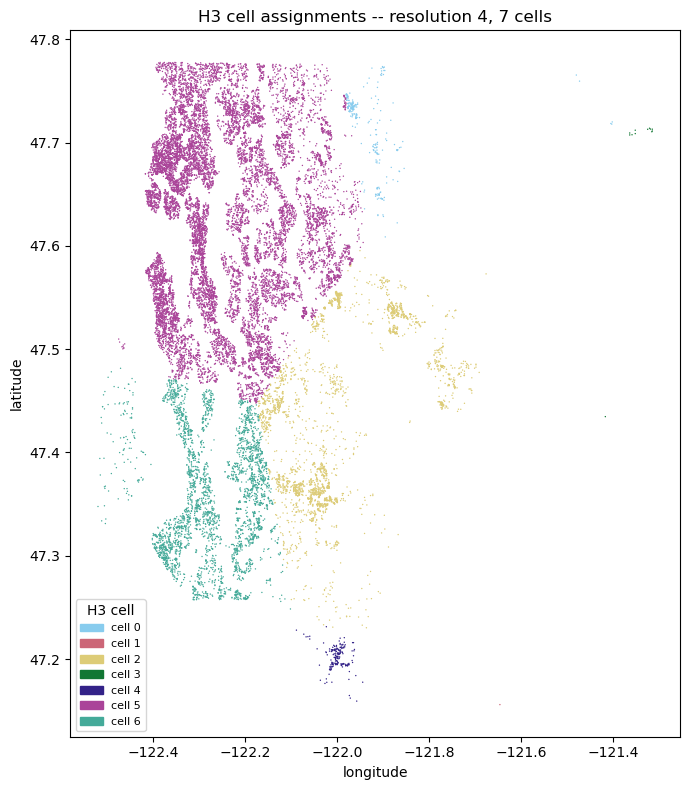
H3 resolution 4 yields 7 occupied cells over King County. Increase
the resolution for finer-grained blocks (resolution 5 gives ~26 cells
over this dataset). Use min_test_size to exclude cells with very few
observations from serving as test folds.
cv = LeaveCellOut(grid='h3', resolution=4)
splits = list(cv.split(gdf))
print('Resolution :', cv.resolution_)
print('Test folds :', cv.n_cells_, '(one per occupied cell)')
Resolution : 4
Test folds : 7 (one per occupied cell)
/Users/ljwolf/Dropbox/work/dev/geovalidate/src/geovalidate/cv/_cell_stratified_kfold.py:28: UserWarning: Geometry is in a geographic CRS. Results from 'centroid' are likely incorrect. Use 'GeoSeries.to_crs()' to re-project geometries to a projected CRS before this operation.

  pts = geom.centroid
Cell assignments
fig, ax = plt.subplots(figsize=(7, 8))
unique_cells, cell_int = np.unique(cv.cell_ids_, return_inverse=True)
sc = ax.scatter(
    gdf.geometry.x, gdf.geometry.y,
    c=cell_int, cmap=colormaps.safe[:len(unique_cells)], s=1, linewidths=0,
)
handles = [
    mpatches.Patch(color=sc.cmap(sc.norm(i)), label='cell ' + str(i))
    for i in range(len(unique_cells))
]
ax.legend(handles=handles, loc='lower left', fontsize=8, title='H3 cell')
ax.set_title('H3 cell assignments -- resolution ' + str(cv.resolution_) + ', ' + str(cv.n_cells_) + ' cells')
ax.set_xlabel('longitude')
ax.set_ylabel('latitude')
plt.tight_layout()
plt.show()
Fold sizes
pd.DataFrame(
    [{'fold': i, 'test size': len(te), 'train size': len(tr)}
     for i, (tr, te) in enumerate(splits)]
)
| fold | test size | train size | |
|---|---|---|---|
| 0 | 0 | 251 | 21362 |
| 1 | 1 | 1 | 21612 |
| 2 | 2 | 2576 | 19037 |
| 3 | 3 | 12 | 21601 |
| 4 | 4 | 189 | 21424 |
| 5 | 5 | 15223 | 6390 |
| 6 | 6 | 3361 | 18252 |
All folds
ncols = 4
nrows = int(np.ceil(cv.n_cells_ / ncols))
fig, axes = plt.subplots(nrows, ncols, figsize=(4 * ncols, 4 * nrows))
axes = axes.flat

for i, (train, test) in enumerate(splits):
    ax = axes[i]
    ax.scatter(
        gdf.geometry.x.iloc[train], gdf.geometry.y.iloc[train],
        color='steelblue', s=0.3, alpha=0.4,
    )
    ax.scatter(
        gdf.geometry.x.iloc[test], gdf.geometry.y.iloc[test],
        color='firebrick', s=2,
    )
    ax.set_title('Fold ' + str(i) + '  (test n=' + str(len(test)) + ')', fontsize=9)
    ax.set_axis_off()

for ax in list(axes)[cv.n_cells_:]:
    ax.set_visible(False)

fig.legend(
    handles=[
        mpatches.Patch(color='steelblue', label='train'),
        mpatches.Patch(color='firebrick', label='test'),
    ],
    loc='lower right', fontsize=10,
)
fig.suptitle('LeaveCellOut -- all folds', fontsize=13)
plt.tight_layout()
plt.show()
A5 grid
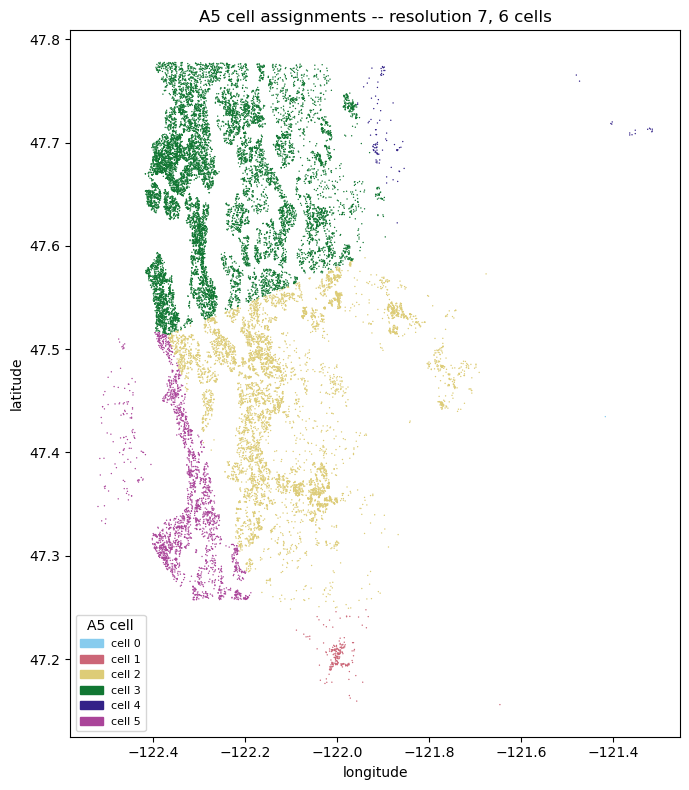
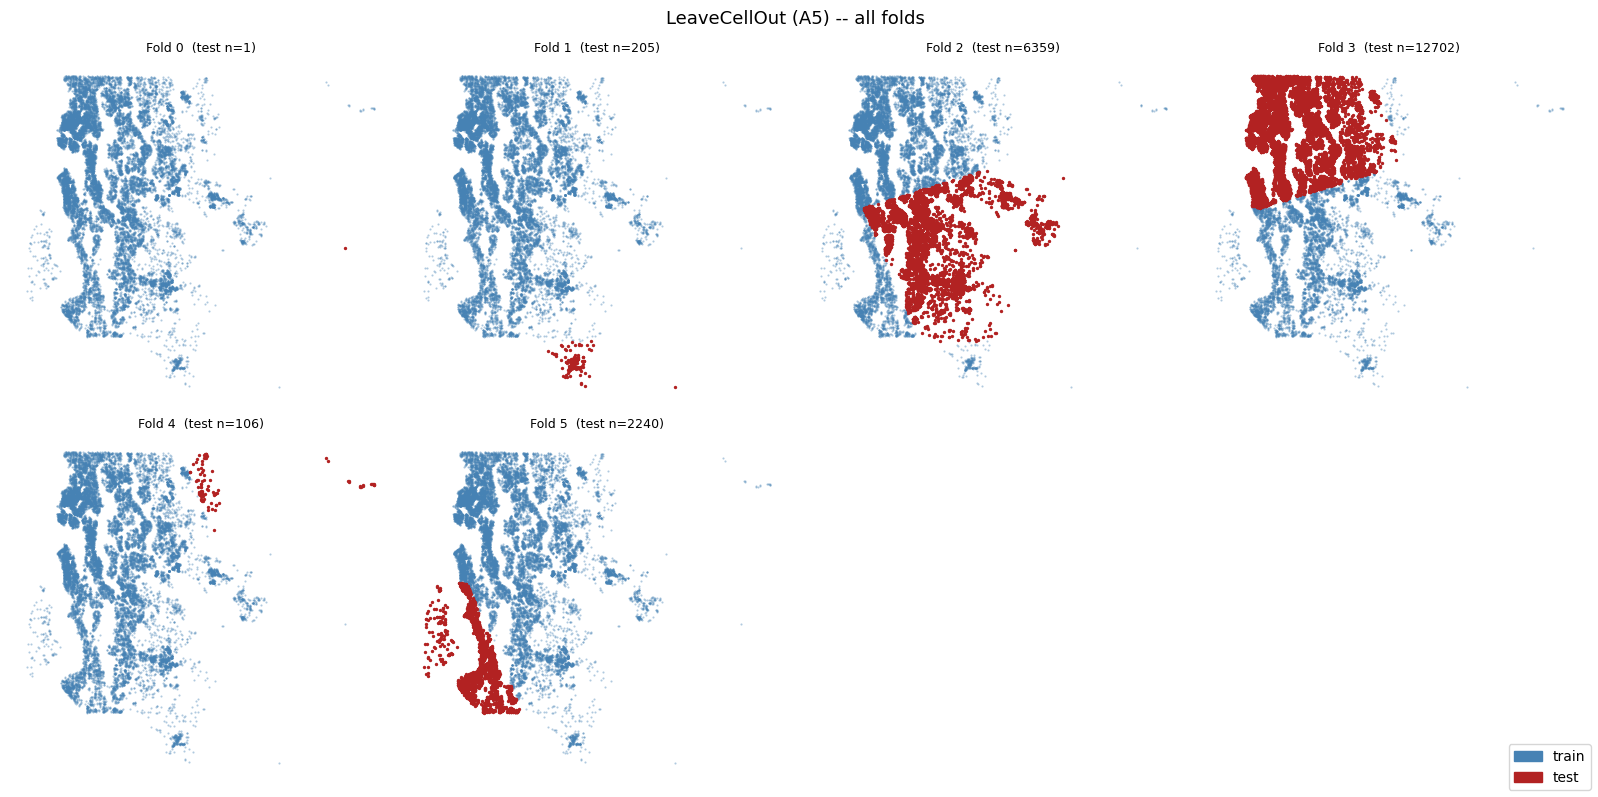
The A5 (Icosahedral Snyder Equal Area) grid partitions the globe into equal-area pentagonal cells. Resolutions 0–30 progress from coarsest to finest. Resolution 7 yields 6 occupied cells over King County, comparable to H3 resolution 4.
cv_a5 = LeaveCellOut(grid='a5', resolution=7)
splits_a5 = list(cv_a5.split(gdf))
print('Resolution :', cv_a5.resolution_)
print('Test folds :', cv_a5.n_cells_, '(one per occupied cell)')
Resolution : 7
Test folds : 6 (one per occupied cell)
/Users/ljwolf/Dropbox/work/dev/geovalidate/src/geovalidate/cv/_cell_stratified_kfold.py:28: UserWarning: Geometry is in a geographic CRS. Results from 'centroid' are likely incorrect. Use 'GeoSeries.to_crs()' to re-project geometries to a projected CRS before this operation.

  pts = geom.centroid
Cell assignments
fig, ax = plt.subplots(figsize=(7, 8))
unique_cells, cell_int = np.unique(cv_a5.cell_ids_, return_inverse=True)
sc = ax.scatter(
    gdf.geometry.x, gdf.geometry.y,
    c=cell_int, cmap=colormaps.safe[:len(unique_cells)], s=1, linewidths=0,
)
handles = [
    mpatches.Patch(color=sc.cmap(sc.norm(i)), label='cell ' + str(i))
    for i in range(len(unique_cells))
]
ax.legend(handles=handles, loc='lower left', fontsize=8, title='A5 cell')
ax.set_title('A5 cell assignments -- resolution ' + str(cv_a5.resolution_) + ', ' + str(cv_a5.n_cells_) + ' cells')
ax.set_xlabel('longitude')
ax.set_ylabel('latitude')
plt.tight_layout()
plt.show()
All folds
ncols = 4
nrows = int(np.ceil(cv_a5.n_cells_ / ncols))
fig, axes = plt.subplots(nrows, ncols, figsize=(4 * ncols, 4 * nrows))
axes = axes.flat

for i, (train, test) in enumerate(splits_a5):
    ax = axes[i]
    ax.scatter(
        gdf.geometry.x.iloc[train], gdf.geometry.y.iloc[train],
        color='steelblue', s=0.3, alpha=0.4,
    )
    ax.scatter(
        gdf.geometry.x.iloc[test], gdf.geometry.y.iloc[test],
        color='firebrick', s=2,
    )
    ax.set_title('Fold ' + str(i) + '  (test n=' + str(len(test)) + ')', fontsize=9)
    ax.set_axis_off()

for ax in list(axes)[cv_a5.n_cells_:]:
    ax.set_visible(False)

fig.legend(
    handles=[
        mpatches.Patch(color='steelblue', label='train'),
        mpatches.Patch(color='firebrick', label='test'),
    ],
    loc='lower right', fontsize=10,
)
fig.suptitle('LeaveCellOut (A5) -- all folds', fontsize=13)
plt.tight_layout()
plt.show()
HEALPix grid
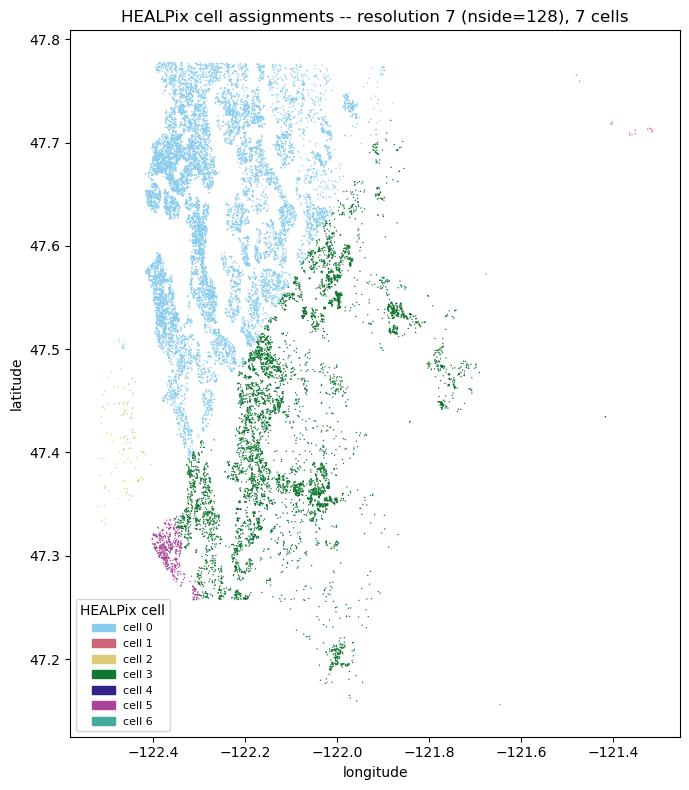
HEALPix (Hierarchical Equal Area isoLatitude Pixelization) divides the sphere
into equal-area pixels arranged in rings of constant latitude. The resolution
parameter is log₂(nside), so resolution 7 = nside 128.
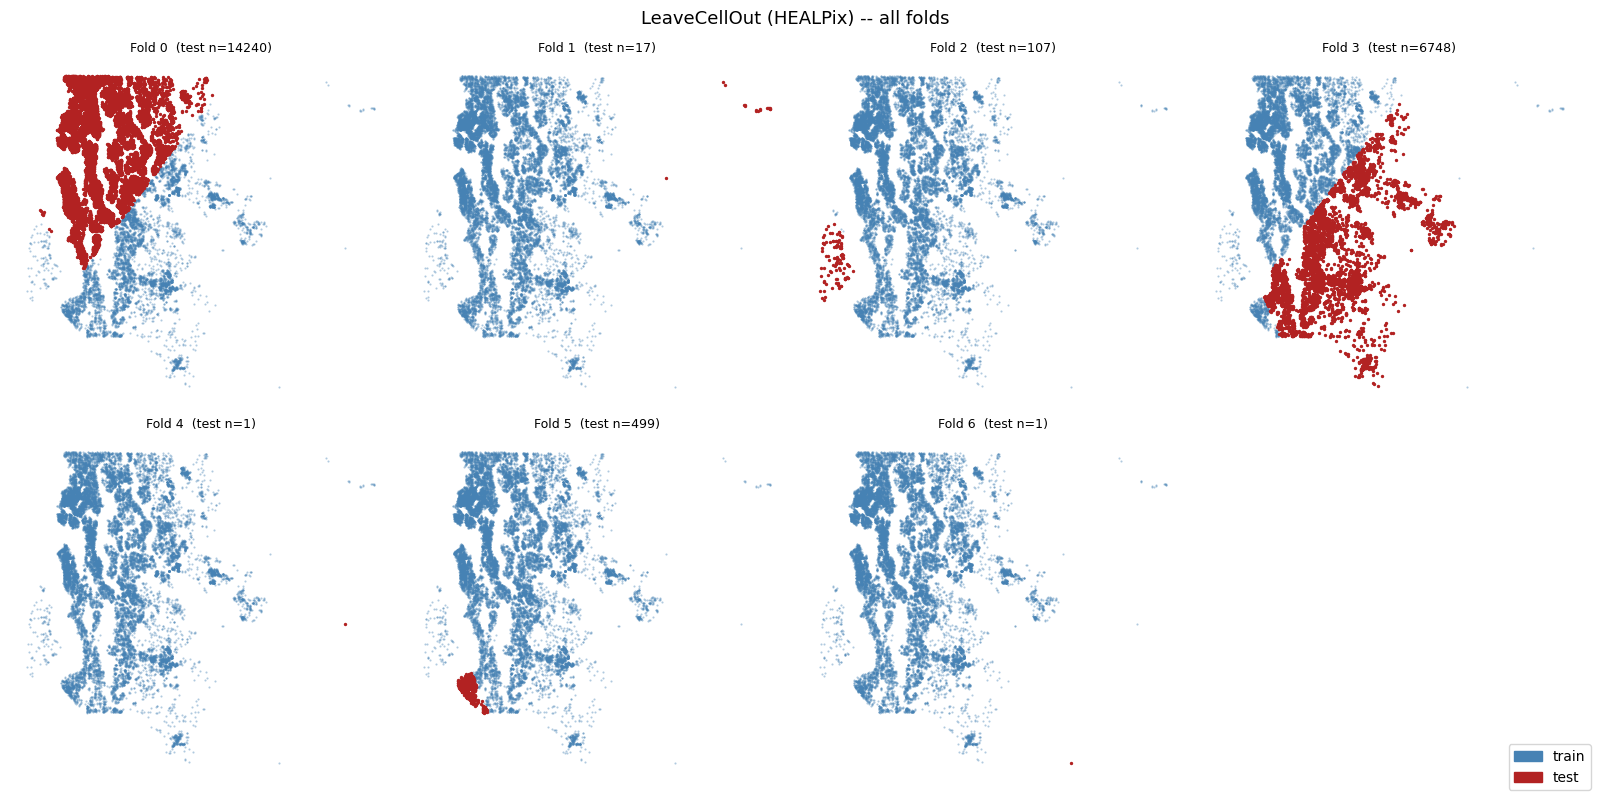
At this resolution, 7 cells cover King County — matching H3 resolution 4.
cv_hp = LeaveCellOut(grid='healpix', resolution=7)
splits_hp = list(cv_hp.split(gdf))
print('Resolution :', cv_hp.resolution_, f'(nside={1 << cv_hp.resolution_})')
print('Test folds :', cv_hp.n_cells_, '(one per occupied cell)')
Resolution : 7 (nside=128)
Test folds : 7 (one per occupied cell)
Cell assignments
fig, ax = plt.subplots(figsize=(7, 8))
unique_cells, cell_int = np.unique(cv_hp.cell_ids_, return_inverse=True)
sc = ax.scatter(
    gdf.geometry.x, gdf.geometry.y,
    c=cell_int, cmap=colormaps.safe[:len(unique_cells)], s=1, linewidths=0,
)
handles = [
    mpatches.Patch(color=sc.cmap(sc.norm(i)), label='cell ' + str(i))
    for i in range(len(unique_cells))
]
ax.legend(handles=handles, loc='lower left', fontsize=8, title='HEALPix cell')
ax.set_title('HEALPix cell assignments -- resolution ' + str(cv_hp.resolution_) + f' (nside={1 << cv_hp.resolution_}), ' + str(cv_hp.n_cells_) + ' cells')
ax.set_xlabel('longitude')
ax.set_ylabel('latitude')
plt.tight_layout()
plt.show()
All folds
ncols = 4
nrows = int(np.ceil(cv_hp.n_cells_ / ncols))
fig, axes = plt.subplots(nrows, ncols, figsize=(4 * ncols, 4 * nrows))
axes = axes.flat

for i, (train, test) in enumerate(splits_hp):
    ax = axes[i]
    ax.scatter(
        gdf.geometry.x.iloc[train], gdf.geometry.y.iloc[train],
        color='steelblue', s=0.3, alpha=0.4,
    )
    ax.scatter(
        gdf.geometry.x.iloc[test], gdf.geometry.y.iloc[test],
        color='firebrick', s=2,
    )
    ax.set_title('Fold ' + str(i) + '  (test n=' + str(len(test)) + ')', fontsize=9)
    ax.set_axis_off()

for ax in list(axes)[cv_hp.n_cells_:]:
    ax.set_visible(False)

fig.legend(
    handles=[
        mpatches.Patch(color='steelblue', label='train'),
        mpatches.Patch(color='firebrick', label='test'),
    ],
    loc='lower right', fontsize=10,
)
fig.suptitle('LeaveCellOut (HEALPix) -- all folds', fontsize=13)
plt.tight_layout()
plt.show()