Over the last month and a half or so, my colleagues at the University of Bristol Quantitative Spatial Sciences Lab (QuSS) have done a hell of a job examining the Boundary Commission for England’s draft plan for Westminster Parliamentary Constituencies across England. We published our findings in a report and a webmap (with explanation, full-screen).
One thing that was very surprising to me is the interplay between depopulation and boundary change:
(c), surprise! the North is pretty re-drawn. It could be due to population change (which is generally pretty rough on the shape of constituencies) but the rapidly-growing South West is the least-redrawn part of the map! Is depopulation harder to redistrict? Needs more science.
— ljw (@levijohnwolf) August 2, 2021
This would suggest that it’s not about change, but rather the direction of change that matters. When you gain districts, you can easily split a “big” district into two smaller districst that follow previous lines. However, when you lose districts, the effect cascades, since it’s rare that valid districts can be drawn from exact aggregates of previous districts.
In the UK, I only have one time period to work from; the government does not hold records of the geographical shapes of districts before the last two redistrictings. And, the government at the time stalled on the last boundary commission’s recommendations…, so I have some doubt that there is political interest in this topic!
But, given my dissertation work on partisan bias in redistricting (and the imminent run-up to redistricting battles in the US), I wanted to check whether depopulation really is harder to redistrict. So, I pulled down my dissertation data, simplified it so that it remained at a constant geographical level of detail, and checked it out.
Below, you can see the “boundary fragmentation” associated with the number of districts gained or lost at decadal redistrictings since 1960. Here, I’m using an entropy-based measure of “boundary fragmentation” that accounts for how thoroughly the current districts change in the new districts. When current districts are split evenly among the new districts, then the measure is large, but when new district lines follow the existing lines, the measure is zero. So, big values means districts are radically changed.
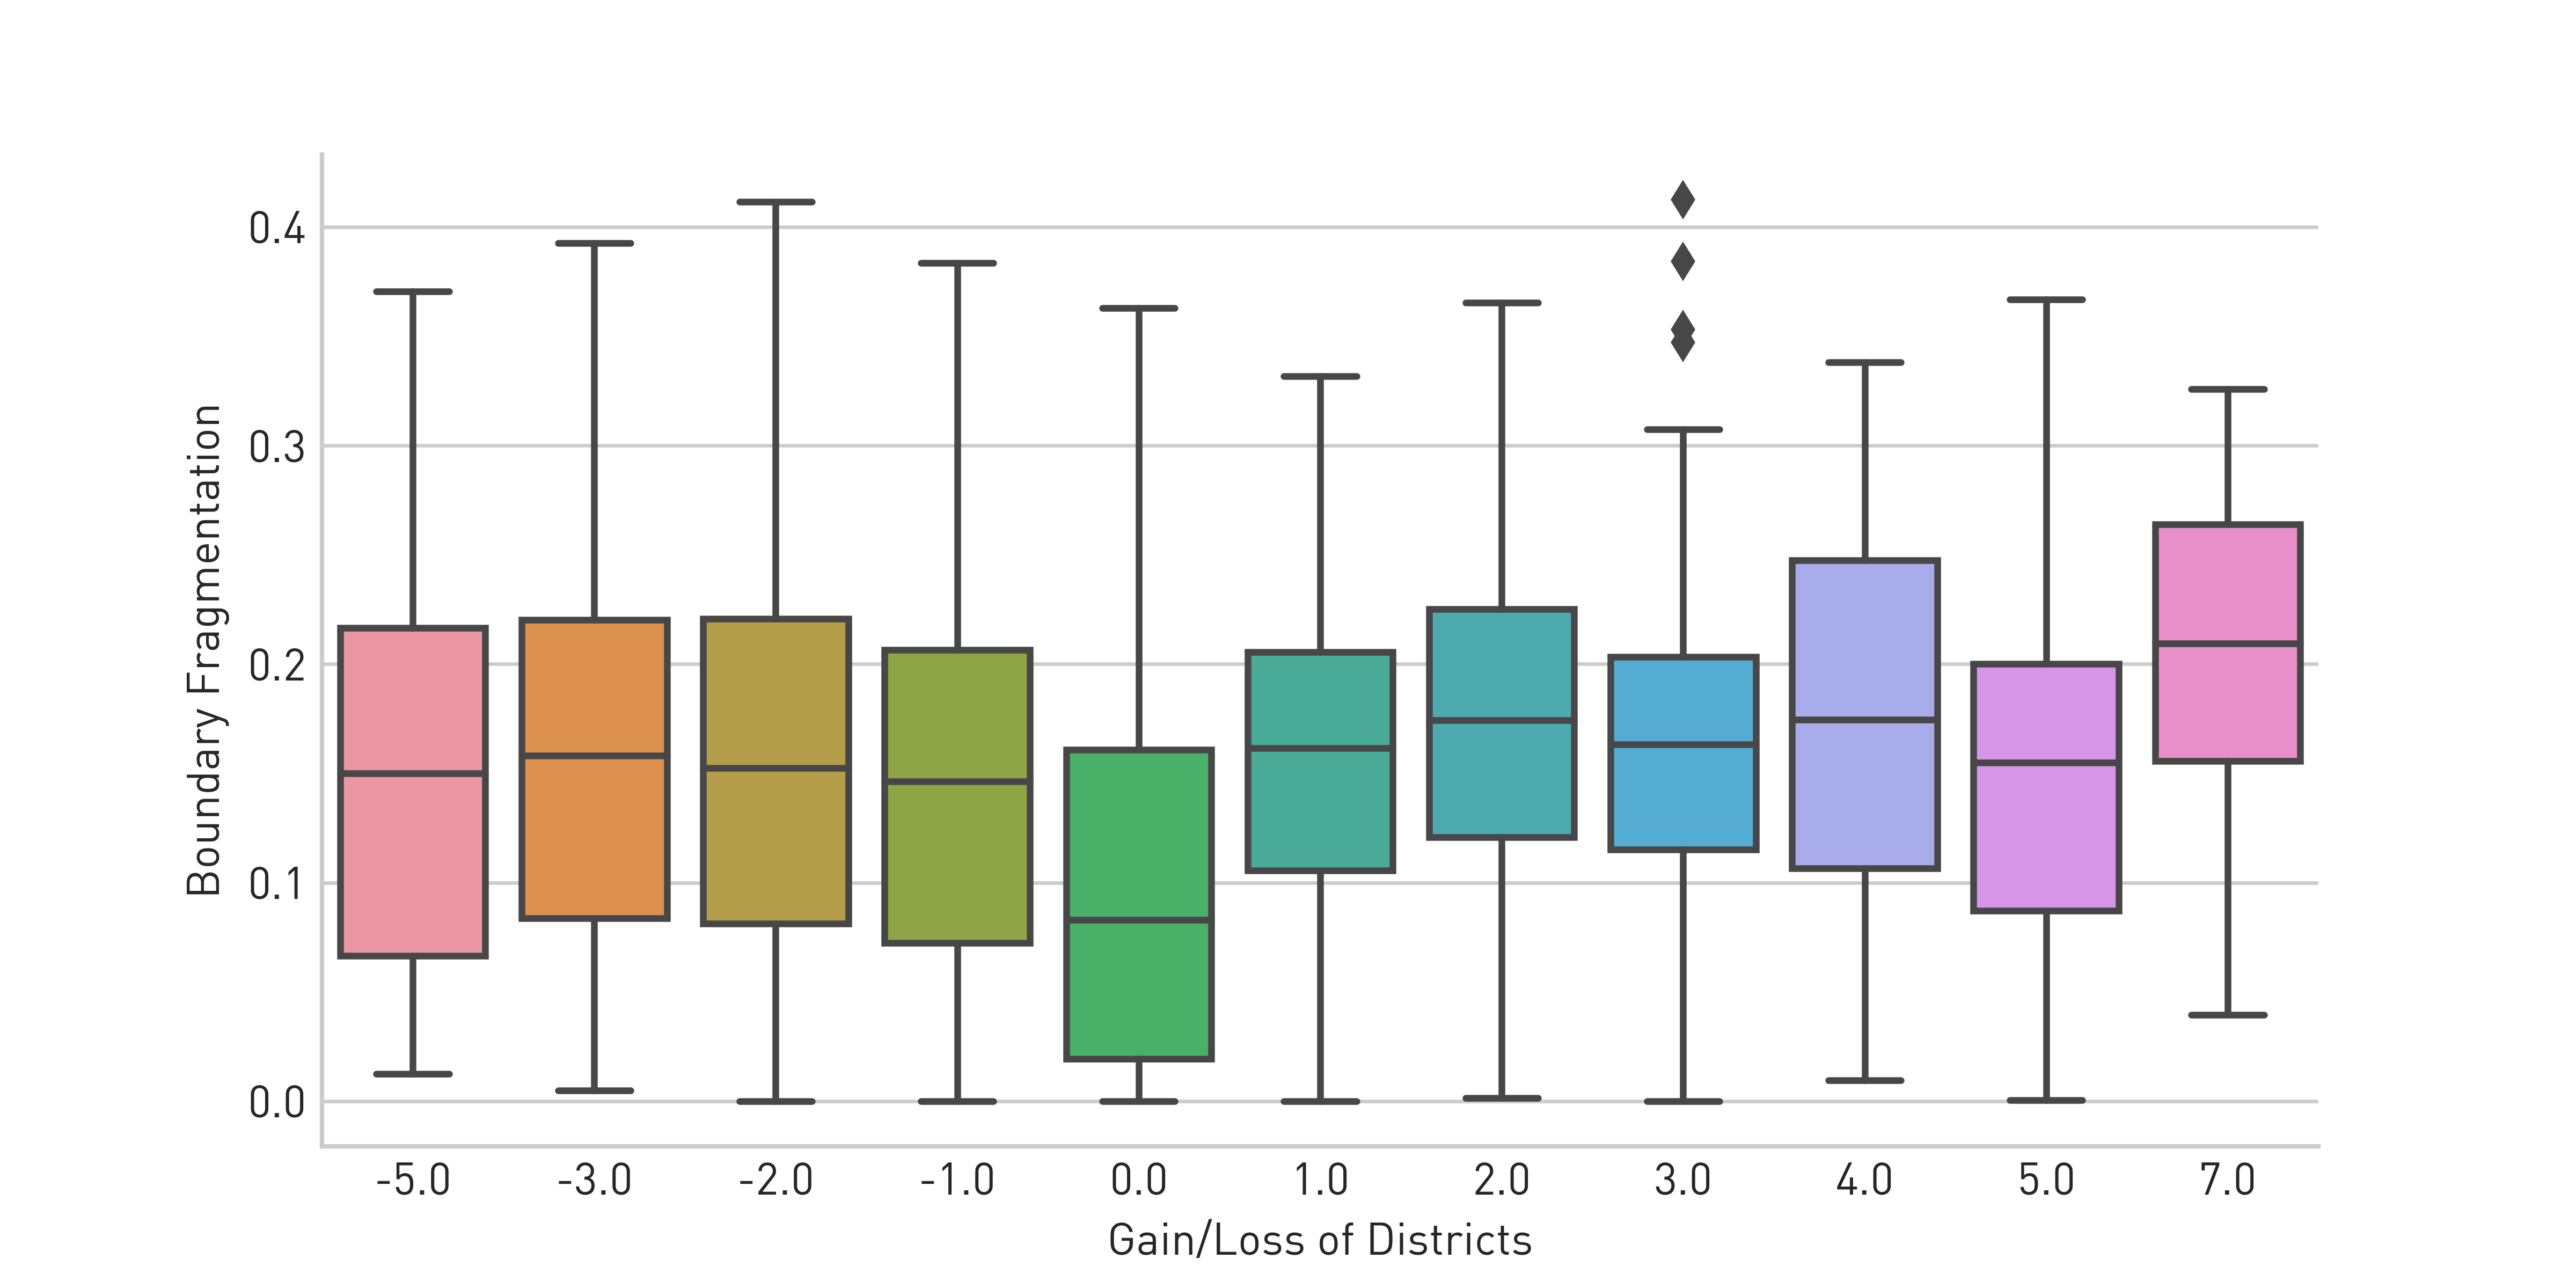
On the right, you can see that California’s huge 7-district gain in the 1990s redistricting really resulted in dramatic district change, in terms of who was grouped with whom. However, it’s not so obvious to me that states that lose districts get more jumbled during redistrictings than states that gain districts. If this were the case, then you’d see one side of the plot having unusually higher (or lower) fragmentation than the other. I don’t see this (statistically or visually). I do need to caveat though, that it’s entirely possible to lose districts in the US (and the UK) while gaining population; you just have to grow more slowly than others. A state that experiences population growth of 1% will be left behind in the next redistricting if other states gain 10%, and this kind of explosive population growth was not unheard of over the course of 20th Century America, compared to much slower growth elsewhere. So, it’s this relative jockeying of position I’m measuring here, rather than absolute depopulation in this first brush.
Collapsing the gain/loss of districts into directions of change, I still don’t see anything obvious that suggests that states that lose districts suffer more dramatic redrawings:
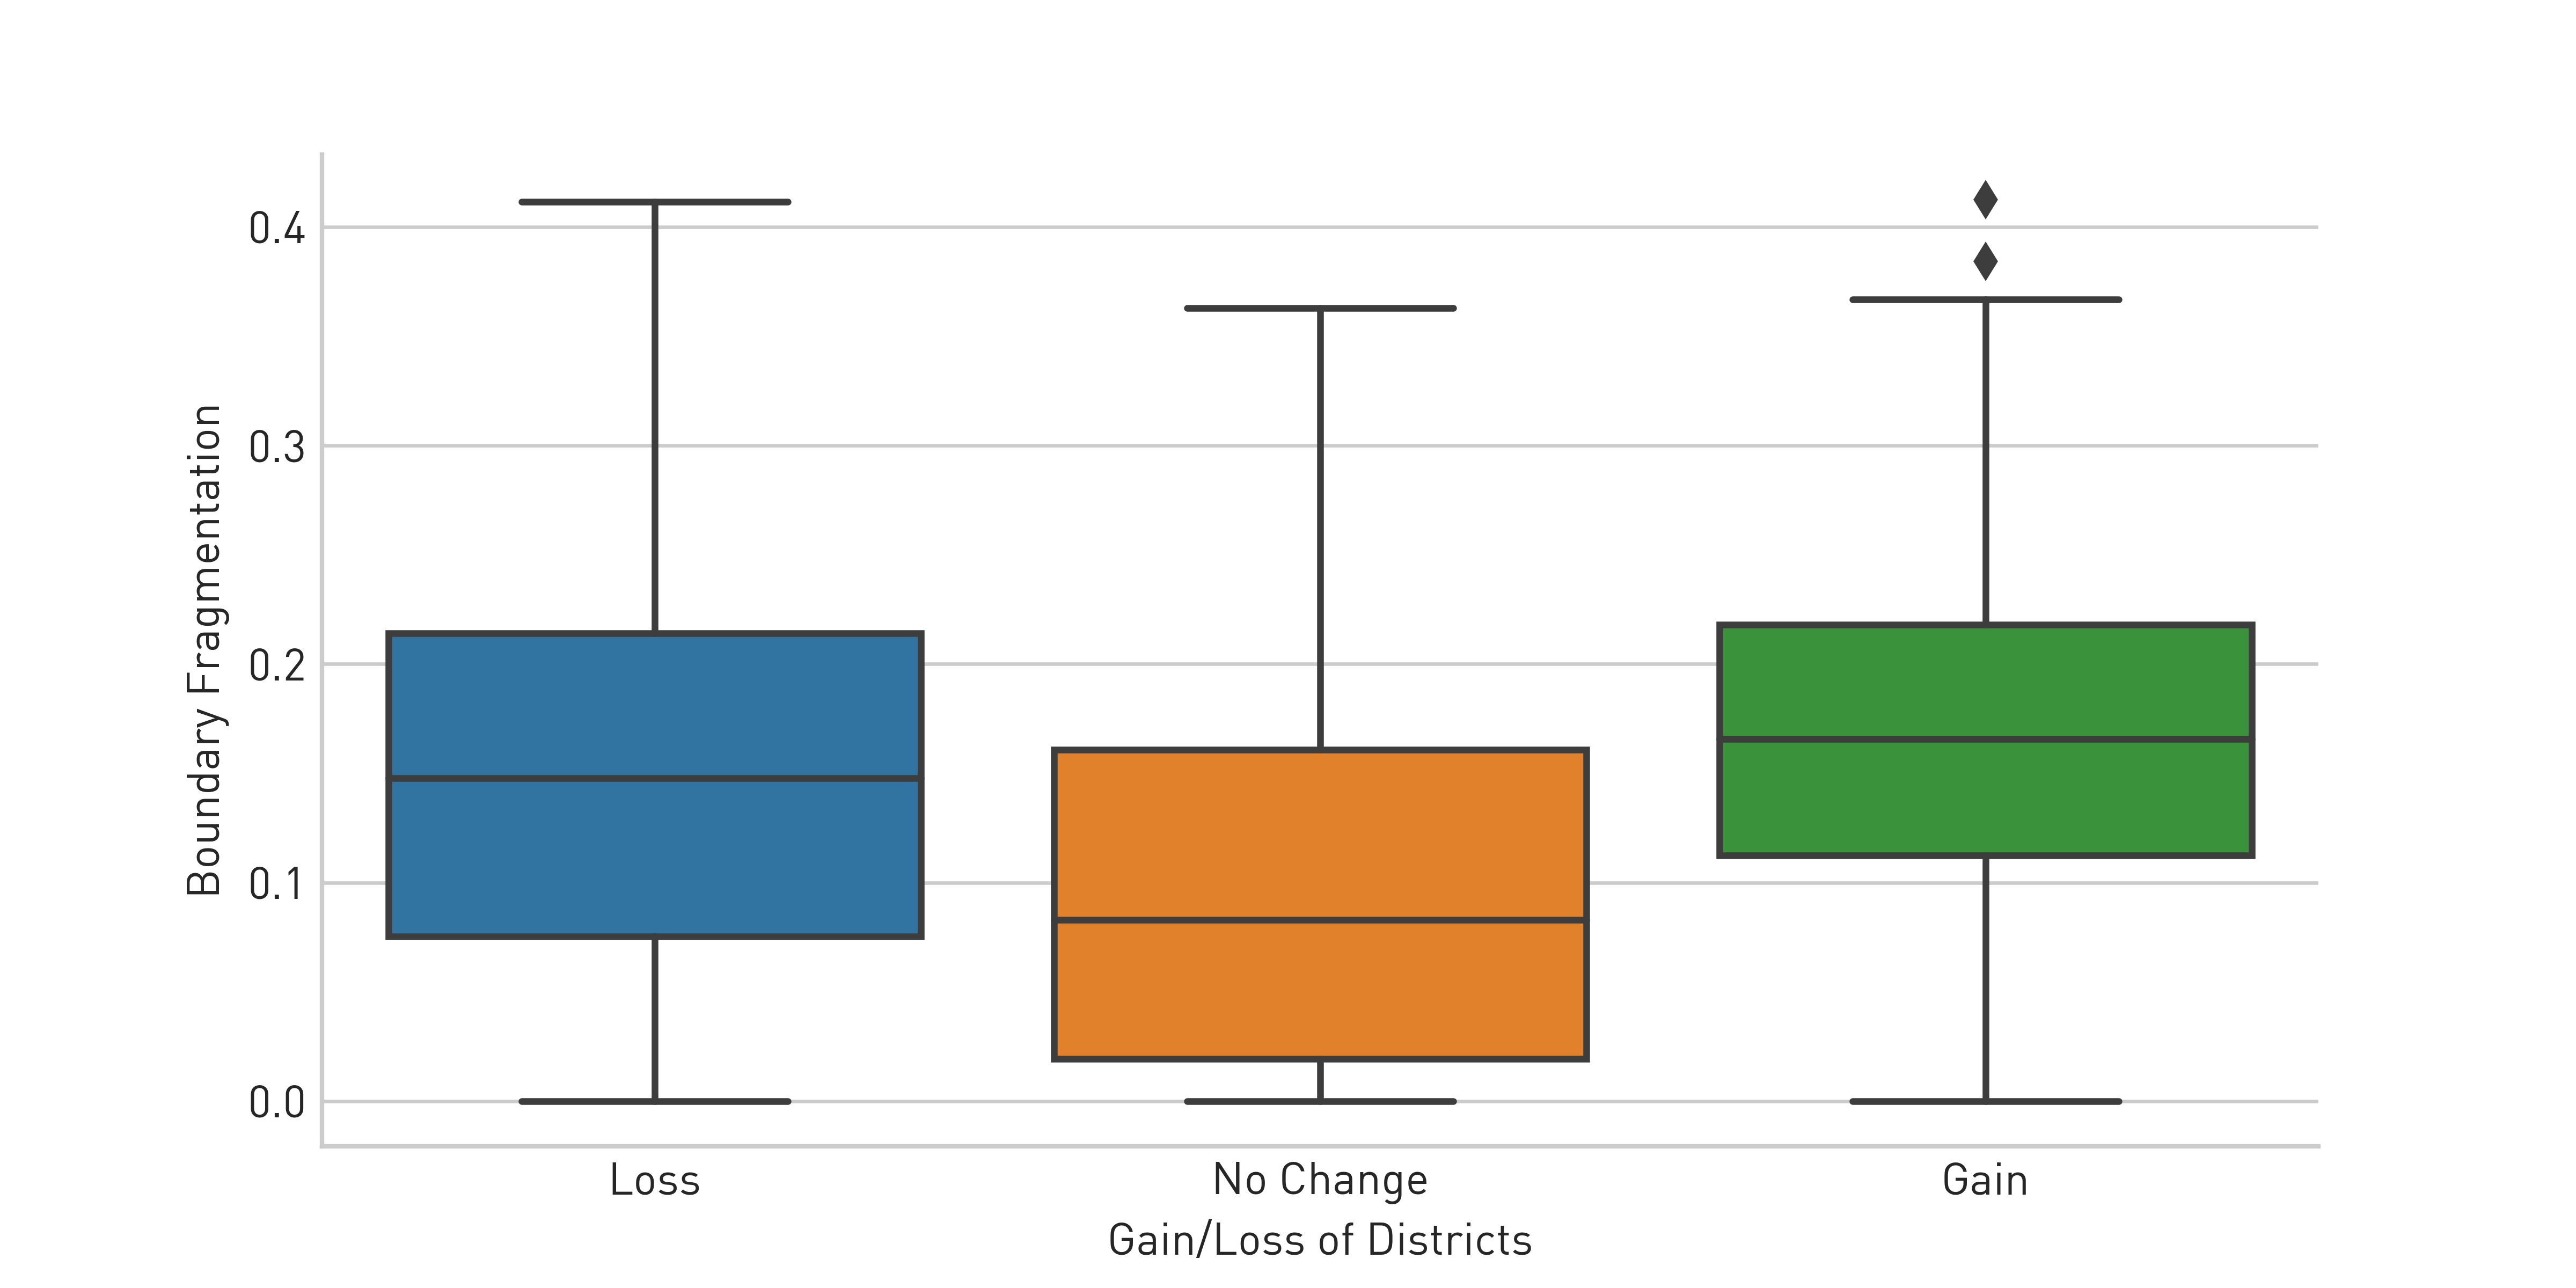
So, I think it’s fair to say, if it is harder to redistrict when you lose seats, I don’t quite see it. Although, I reiterate in this post that analyzing the US distribution here mixes up true depopulation with relative depopulation, since it’s entirely possible for states to gain in population, but not gain enough relative to the population growth overall and lose a district.